
Community Profile
Rich History & Heritage
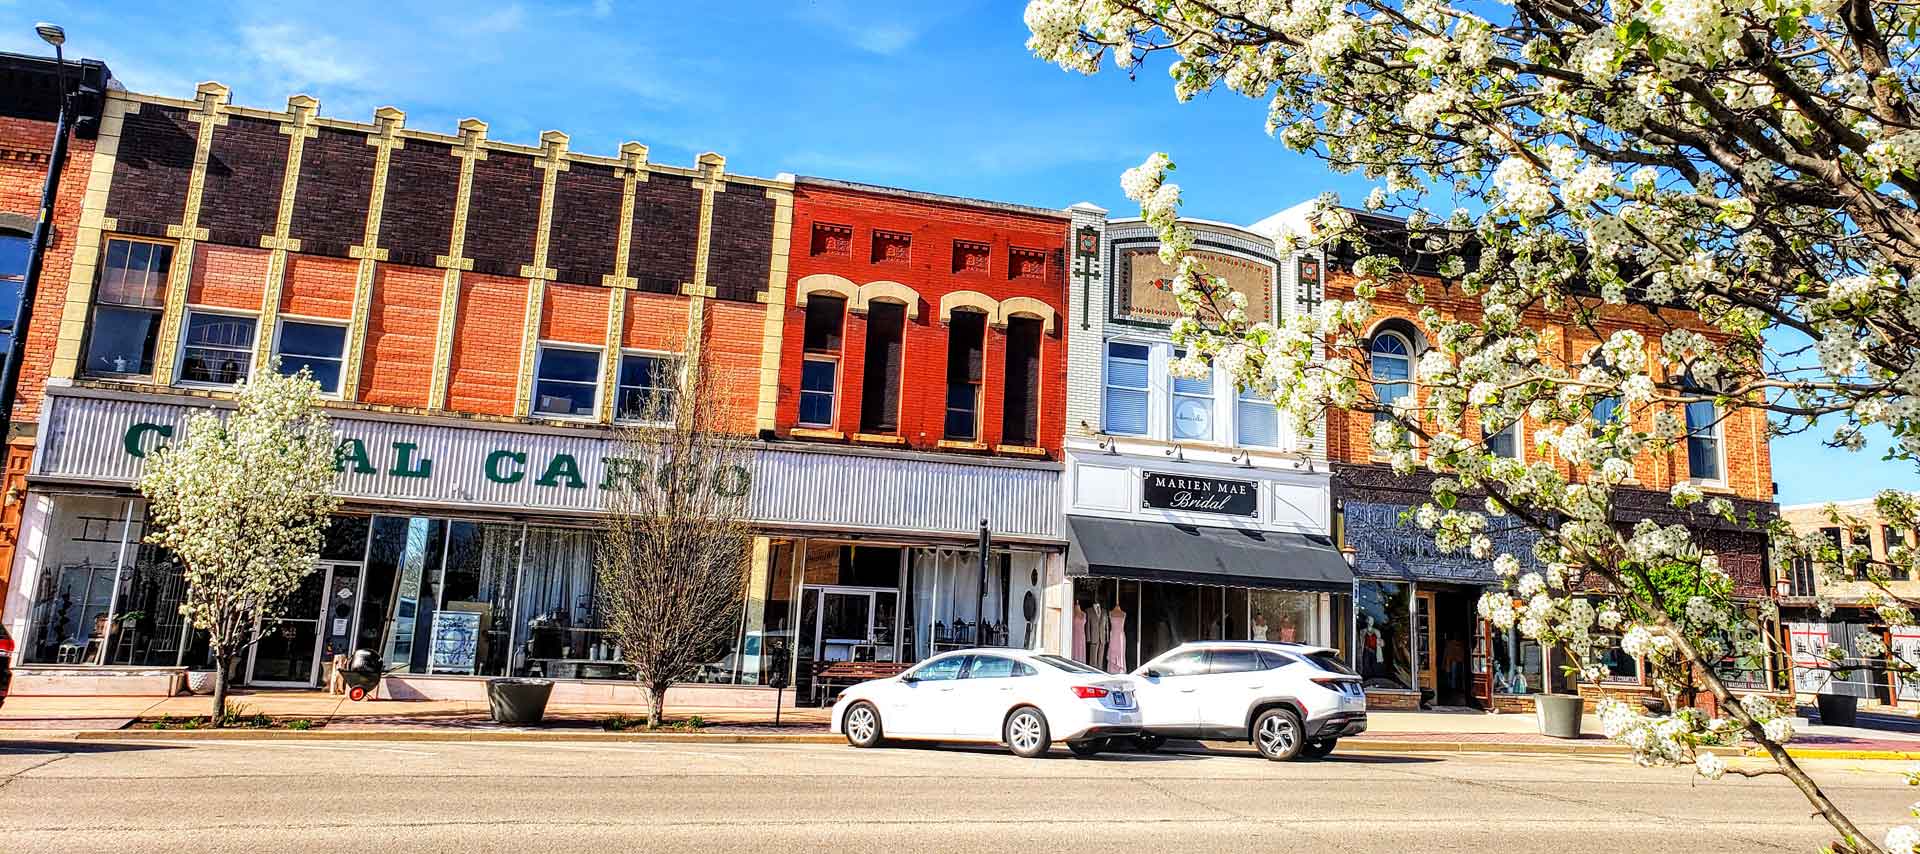
Steeped in history, La Salle boasts a storied past dating back to its early days as a bustling trading post along the Illinois and Michigan Canal. Today, echoes of the city’s heritage can be found in its well-preserved architecture, historic landmarks, and vibrant cultural scene. From the Hegeler Carus Mansion to the I&M Canal National Heritage Area, La Salle offers a fascinating journey through time for history enthusiasts and curious visitors alike.
Residents of La Salle enjoy a high quality of life with access to a wide range of amenities, recreational opportunities, and community services. The city boasts an extensive parks system — including the scenic Starved Rock State Park — offers ample opportunities for hiking, boating, and picnicking. Cultural attractions such as the La Salle County Historical Society Museum and the Lock 16 Café & Visitor Center provide enriching experiences for residents and visitors alike.
Community Data Snapshot
Demographics
Population — 9,582
Median Age — 40.2
Persons Ages 20 and Older — 76.25%
Persons Age 65 Years or Older — 19.9%
Median Household Income — $49,583
Median Family Income — $63,452
Median Married-Couple Family Income — $80,583
Housing
Total Housing Units — 4,483
Median Gross Rent — $957
Homeownership Rate — 61.7%
Bedrooms in Occupied Housing Units (1 or Fewer Bedrooms) — 8.9%
Bedrooms in Occupied Housing Units (2-3 Bedrooms) — 81.5%
Bedrooms in Occupied Housing Units (4 or More Bedrooms) — 9.7%
Education
(Data based on residents ages 25 and older.)
High School or Equivalent Degree — 38.0%
Some College, No Degree — 26.2%
Associate’s Degree — 9.7%
Bachelor’s Degree — 8.2%
Graduate or Professional Degree — 4.5%
Language Spoken at Home
English Only — 87.3%
Spanish — 10.3%
Other Indo-European Languages — 2.0%
Asian and Pacific Islander Languages — 0.3%
Employment
Private Company Workers — 81.0%
Local, State, and Federal Government Workers — 10.2%
Private Not-for-Profit Wage and Salary Workers — 5.0%
Self-employed in Own Incorporated Business — 2.5%
Self-employed in Own Not Incorporated Business and Unpaid Family Workers — 1.3%
Employment Rate — 60.3%
Race & Ethnicity
White — 7,570
Not Hispanic or Latino — 7,130
Hispanic or Latino — 1,729
Two or More Races — 1,028
Some Other Race — 582
Black or African American — 254
Asian — 87
American Indian and Alaska Native — 60
Native Hawaiian or Other Pacific Islander — 1
